Weather in North West Manchester: city records or a regional forecast?
North West Manchester weather numbers here are historical Manchester records, not today’s conditions. See November averages, rainfall, and temperature extremes—and learn how to use official forecasts for planning.
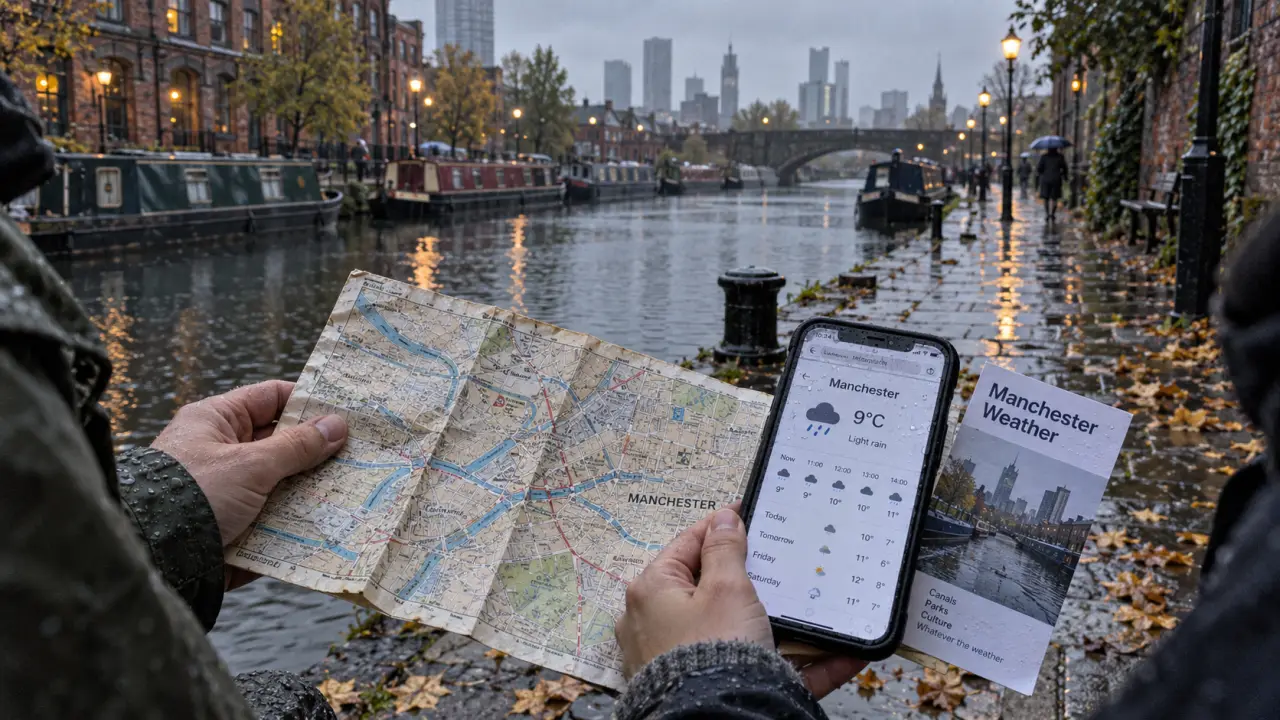
Looking for weather in North West Manchester today? The figures below are historical Manchester records, not current conditions or an hourly forecast. They cannot confirm today’s rain, wind or weather warnings.
North West weather forecast: Manchester or the wider region?
Before planning a journey, check whether your forecast names Manchester, Greater Manchester or North West England. The Manchester figures here should not be treated as a forecast for the whole region, or specifically for neighbourhoods north-west of the city centre.
Official 7-Day Weather Forecast for Manchester – Check Manchester’s latest forecast, warnings, temperatures, rain, wind, visibility, humidity and UV levels.
For a canal-side walk, match the forecast to your departure and return times rather than relying on a daily headline. Check rain probability and gusts for both legs: a dry outward journey alone is not enough to plan the return.
Manchester’s November temperature and rainfall averages
The November baseline is an average high of 9.9°C and an average low of 4.7°C, with 102 mm of rainfall and 16.8 rainy days. These averages describe the month, not the timing of individual showers.
The reference period is 1 October 2016 to 30 September 2026, using Open-Meteo.com (ERA5, Copernicus).
Recorded extremes and the September comparison
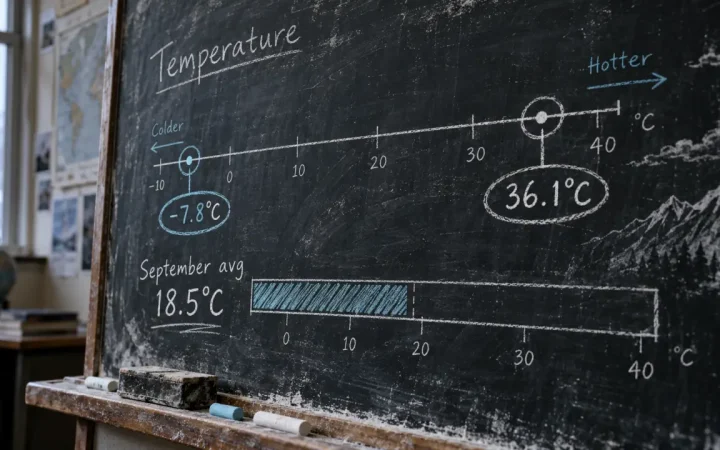
Across that ten-year period, the highest recorded temperature was 36.1°C and the lowest was -7.8°C. Neither represents a typical November day.
September 2026 had an average high of 18.5°C, compared with the September reference average of 17.7°C: a difference of 0.8°C, using the same Open-Meteo archive. This is a historical comparison, not an indication of temperatures in the coming days.